
News
From 5G coverage to 5G quality
Reliable connectivity is no longer a luxury — it is the foundation of economic growth, innovation and inclusion. Yet not all “coverage” is created equal.
This is why national regulators, telecom authorities and operators across Europe, the Middle East, Asia, Africa and the Americas are shifting from coverage mapping to quality-of-service (QoS) mapping. Instead of collecting random field tests, the emerging methodologies rely on modelling and standardized geospatial data to estimate how 5G performs across every grid cell of a territory — from dense urban cores to remote rural settlements.
Such models answer the questions that matter for policy and investment:
- Where are the real gaps in service quality, not just in signal presence?
- How do low-, mid- and high-band frequencies perform in different environments?
- Which areas should be prioritized for funding, licensing obligations or state aid?
- Are operator coverage claims verifiable in a transparent, comparable way?
Applying the same rules and the same input data quality nationwide is what finally makes 5G quality maps comparable — between regions, between operators and between countries. And any model of this kind is only as good as the terrain and clutter data underneath it.
The idea is simple: you can’t improve what you can’t see.
Why 5 m instead of 10 m: a technical necessity
The use of a 5-meter digital model instead of a 10-meter model for 5G network planning and optimization is not a matter of preference. It is driven by the physics of high-frequency wave propagation and by the architecture of the network itself. A smaller cell size allows a far more detailed analysis of how the signal interacts with obstacles and the surrounding environment, and therefore produces better predictions of coverage and network performance.
1. Geometric accuracy and level of detail
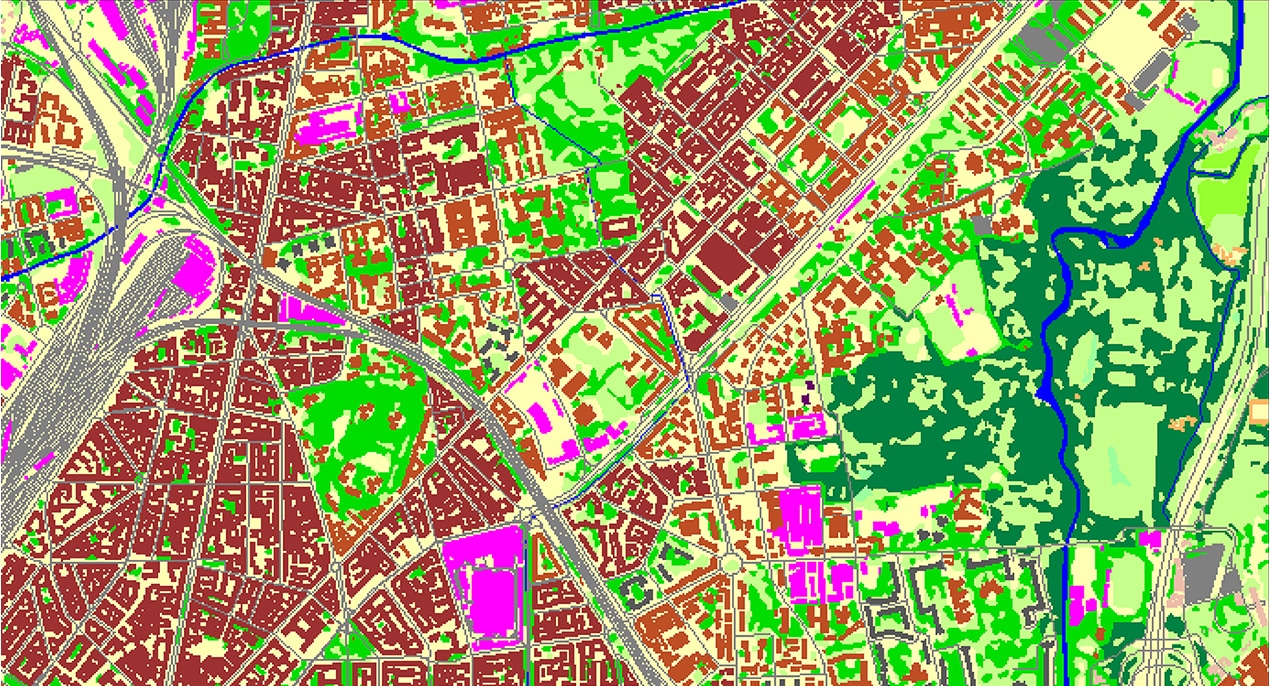
The resolution of the model defines the size of each surface “pixel” (cell). At 10 m resolution one cell covers 100 m²; at 5 m resolution it covers 25 m² — four times higher data density. This reveals significantly more detail in terrain geometry and surface types that a 10-meter model smooths out or loses completely, creating a misleading impression that no obstacle is present.
2. Sensitivity of 5G frequency bands (C-band and mmWave)
- Obstacles: radio waves in these bands have very limited ability to diffract around objects. Any tree, small building protrusion or billboard effectively becomes an impenetrable barrier.
- Line-of-Sight: LoS accuracy depends critically on the precise position of object edges. An error of 5–10 meters in the mapped position of a building corner can mean that in reality the base station has no clear line of sight, while the model predicts optimal signal conditions.
3. Clutter and clutter-height modelling
- In 10 m models, small green areas and isolated groups of trees are absorbed into surrounding classes (for example, “asphalt”), which underestimates vegetation-induced signal loss. Low-rise structures may also mask taller objects, distorting vertical obstruction analysis.
- In 5 m models, vegetation boundaries are clearly delineated — critical for seasonal (“leaf-on”) attenuation modelling — and clutter heights reflect real-world structures far more accurately, reducing errors in path loss and shadowing estimation.
Higher-resolution clutter height data significantly improves the modelling of shadowing effects and vertical signal obstruction, which are decisive for mid-band and mmWave 5G.
4. Error propagation and risk reduction
Even a small positional or height error in the input geodata propagates through the radio planning model and produces significantly larger errors in predicted signal strength, throughput and overall QoS indicators.
- In 10 m models, errors tend to accumulate, increasing uncertainty across the entire prediction chain.
- In 5 m models, errors remain localized, limiting their impact on network performance estimates.
The 5 m model is not simply “more accurate” — it is fundamentally less risky for network design and for regulatory assessment.
5. Hybrid strategies
Many operators start with 2.5D data for the national footprint and then selectively add 3D tiles for urban areas.
| Scenario | Recommended geodata |
| Rural /Suburbs | 2.5D 5 m resolution, or hybrid 2.5D 5 m + 3D 5 m |
| Corridors along railways and highways | 2.5D 5 m resolution, or hybrid 2.5D 5 m + 3D 5 m in settlements |
Upgrading an existing 10 m nationwide model to 5 m
For countries and operators that already hold a 2.5D 10 m nationwide model, the upgrade path is straightforward and does not require starting from scratch.
- Input data is available today. Current satellite imagery and elevation sources allow fast production of a 5 m model, updated to the present year and improved across all accuracy parameters.
- The denser and more complex the country, the greater the gain. In densely populated territories and in areas with complex terrain, a smaller matrix cell size and higher model accuracy have a significant impact on the quality of 5G network calculations.
- Two implementation options: a full country-wide upgrade, or a hybrid strategy in which resolution follows the value of the territory.
The bigger picture
High-resolution mapping is not a technical exercise. It is the basis for smart policy and efficient investment. Reliable maps allow regulators and operators to target public funding where it is genuinely needed, avoid duplication in network deployment, evaluate operator claims transparently, and monitor progress toward national digital targets.
Without precise mapping, decisions rest on outdated assumptions and inconsistent reports. With it, any country — regardless of region, density or terrain — can focus its efforts where citizens and businesses still lack high-quality 5G access.